Hardware Debugging In Eclipse
Build a binary with debugging information using command line or via Eclipse make target.
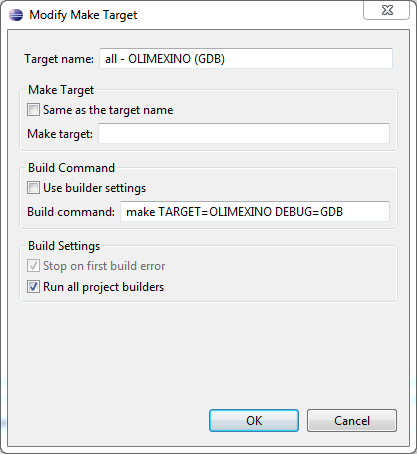
Example Eclipse make target
GDB and OpenOCD
start openocd
Create a new debug configuration in eclipse :


you can control openocd with a telnet connection:
telnet localhost 4444
stop the board, flash the firmware, restart:
	reset halt
	wait_halt
	sleep 100
	poll
	flash probe 0
	flash write_image erase /home/user/git/cleanflight/obj/cleanflight_NAZE.hex 0x08000000
	sleep 200
	soft_reset_halt
	wait_halt
	poll
	reset halt
A this point you can launch the debug in Eclispe.

GDB and J Link
Here are some screenshots showing Hydra's configuration of Eclipse (Kepler)
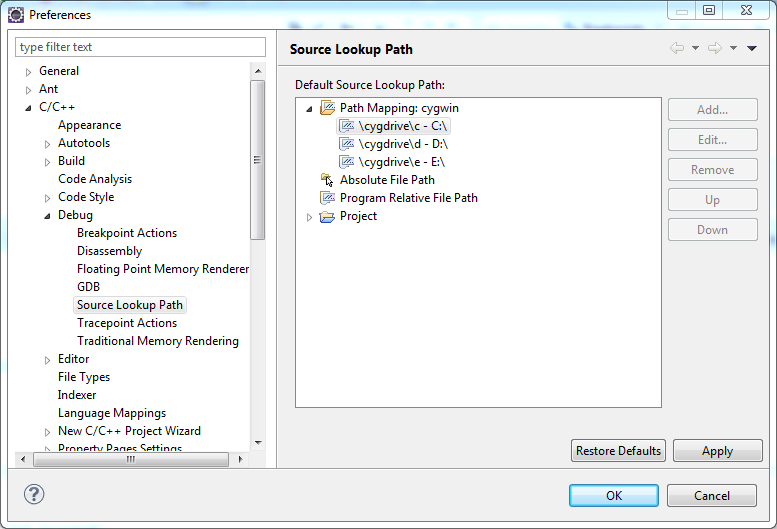
If you use cygwin to build the binaries then be sure to have configured your common Source Lookup Path, Path Mappings first, like this:
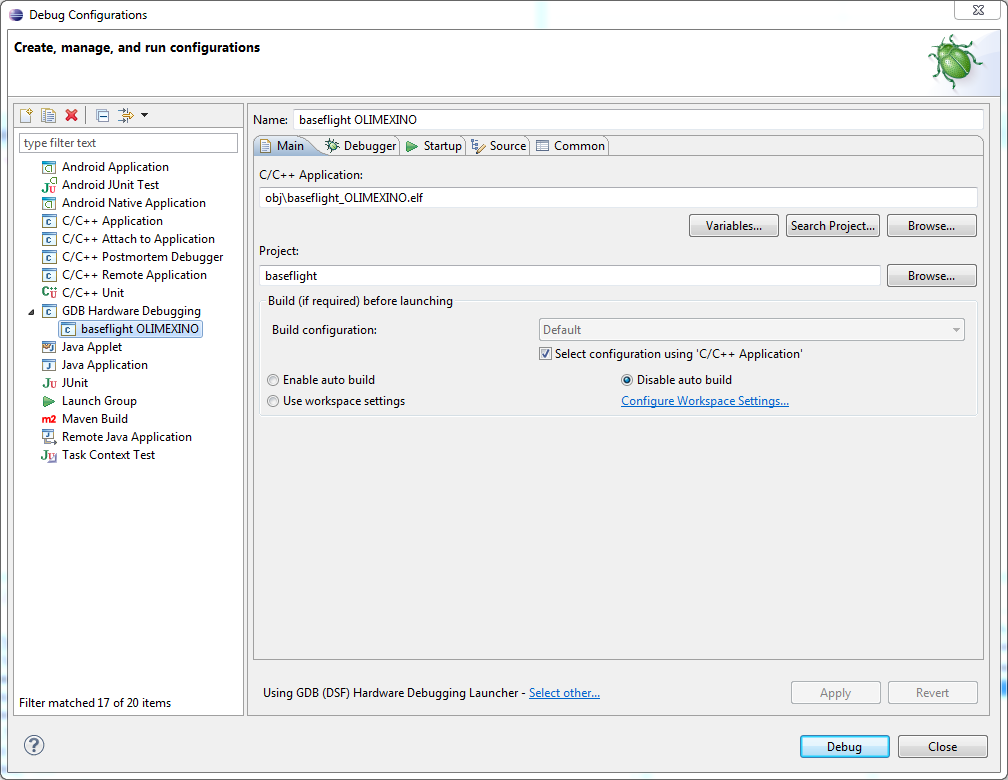
Create a new GDB Hardware Debugging launch configuration from the Run menu
It's important to have build the executable compiled with GDB debugging information first. Select the appropriate .elf file (not hex file) - In these examples the target platform is an OLIMEXINO.
DISABLE auto-build
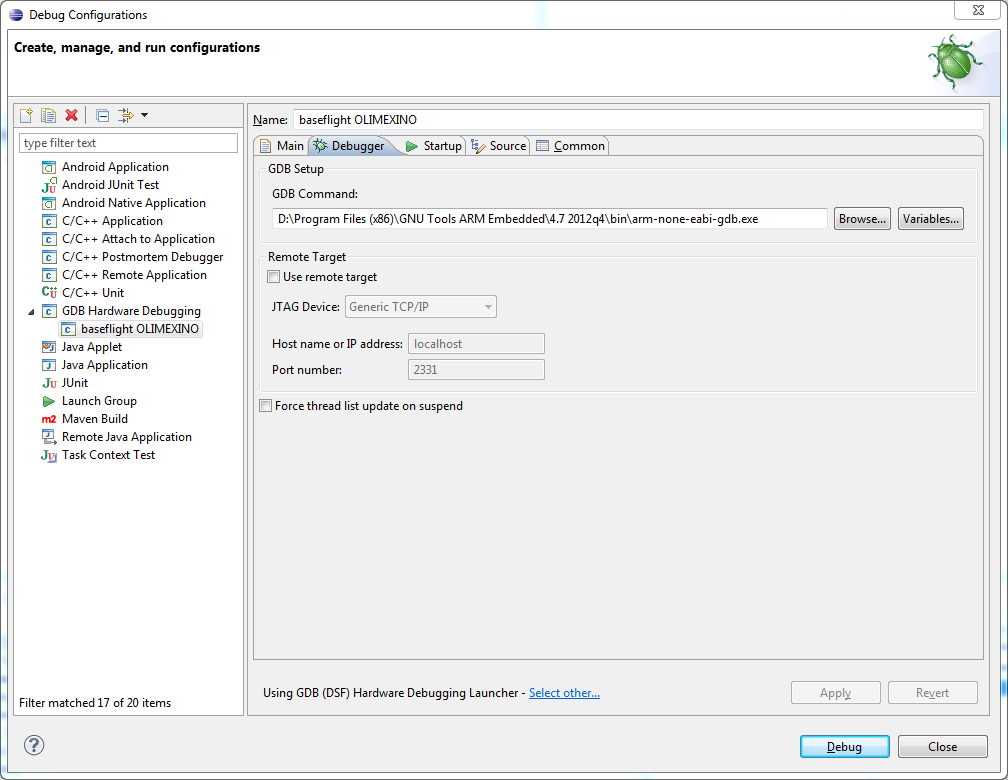
Choose the appropriate gdb executable - ideally from the same toolchain that you use to build the executable.
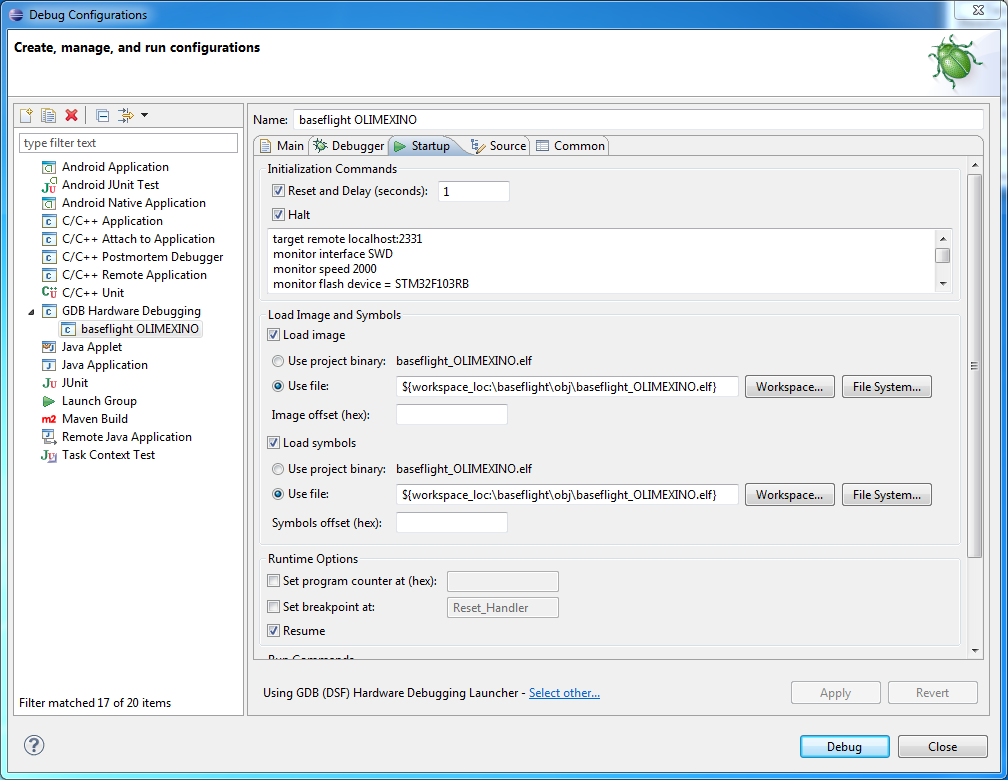
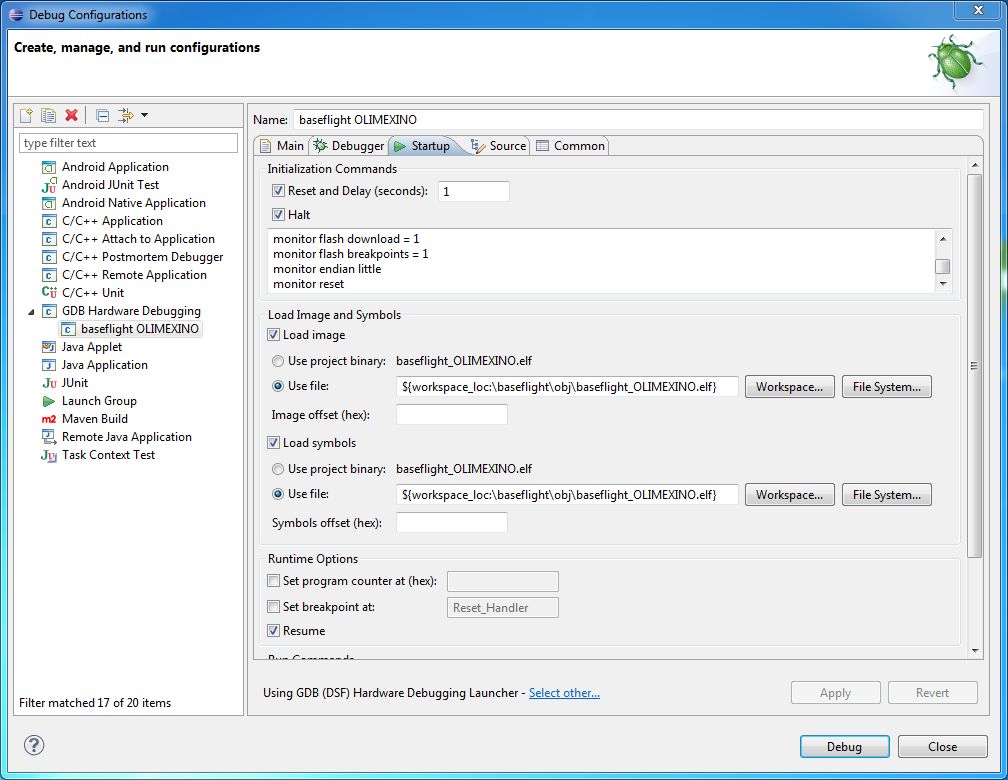
Configure Startup as follows
Initialization commands
target remote localhost:2331
monitor interface SWD
monitor speed 2000
monitor flash device = STM32F103RB
monitor flash download = 1
monitor flash breakpoints = 1
monitor endian little
monitor reset
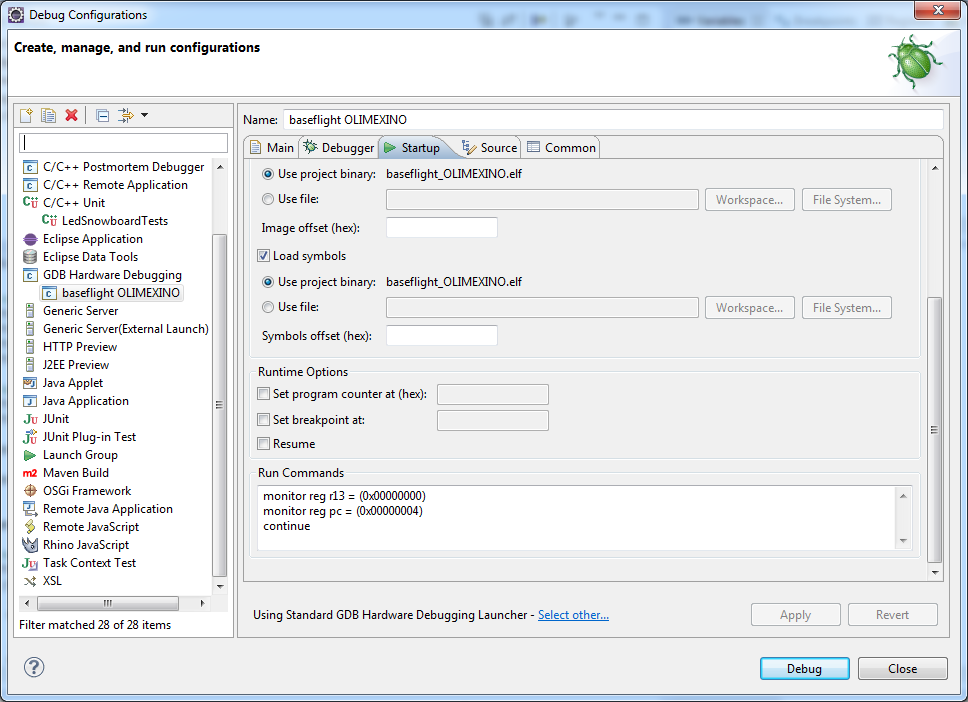
It may be useful to specify run commands too:
monitor reg r13 = (0x00000000)
monitor reg pc = (0x00000004)
continue
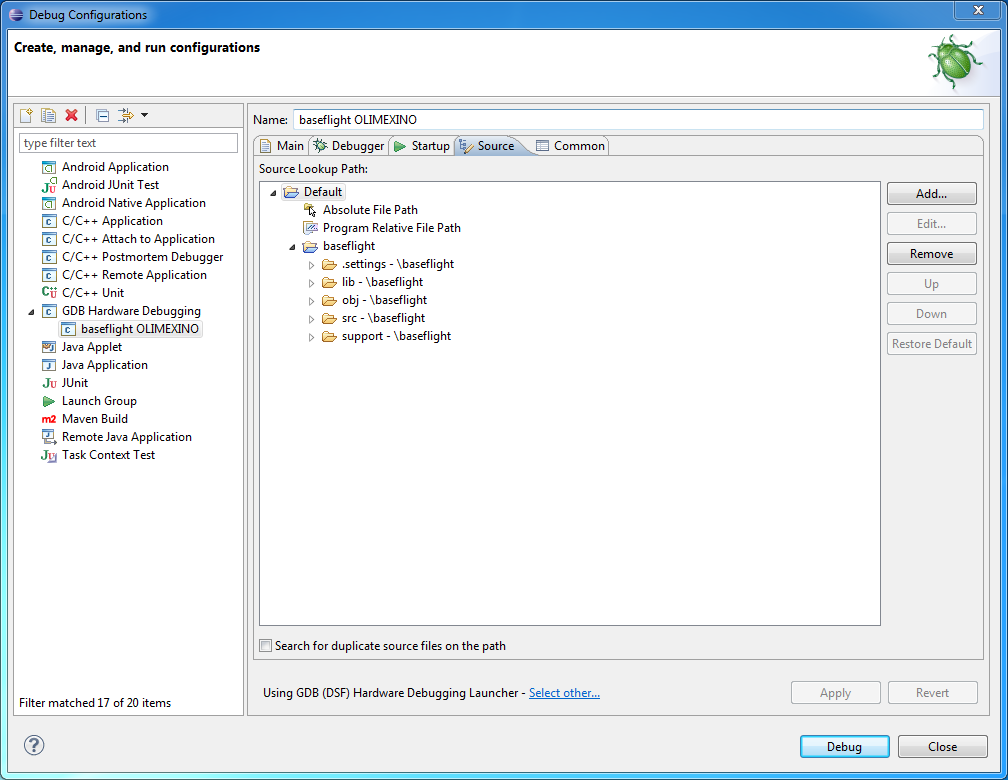
If you use cygwin an additional entry should be shown on the Source tab (not present in this screenshot)
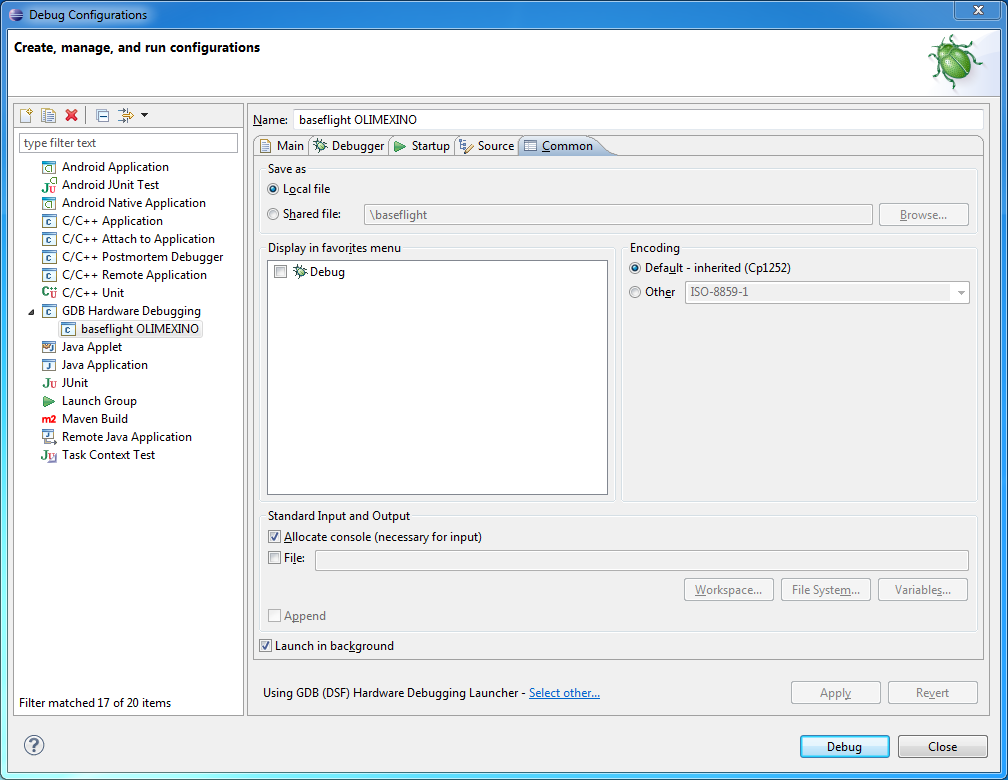
Nothing to change from the defaults on the Common tab
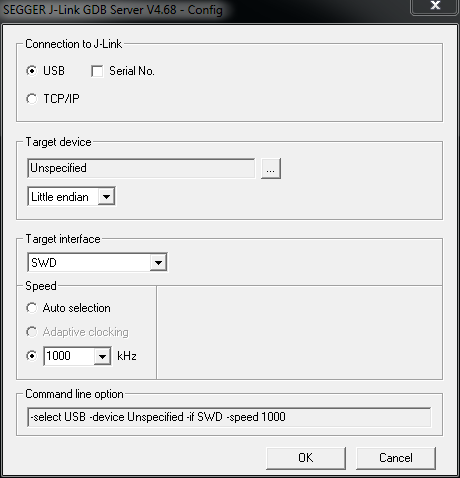
Start up the J-Link server in USB mode
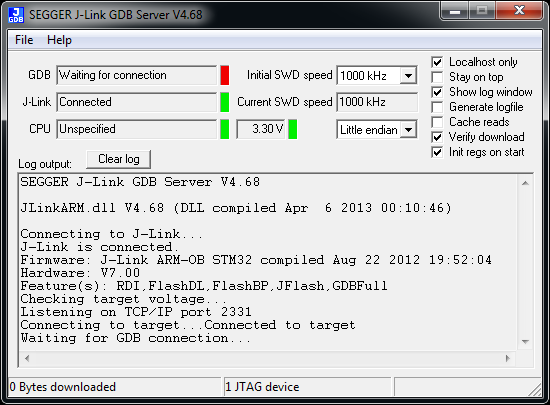
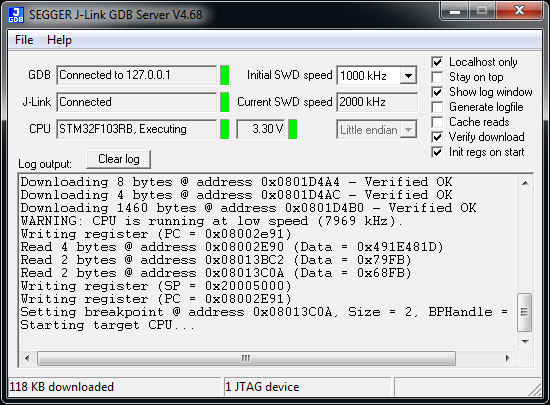
If it connects to your target device it should look like this
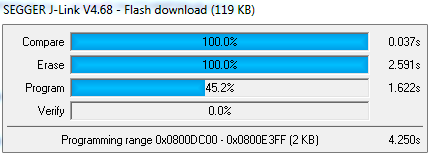
From Eclipse launch the application using the Run/Debug Configurations..., Eclipse should upload the compiled file to the target device which looks like this
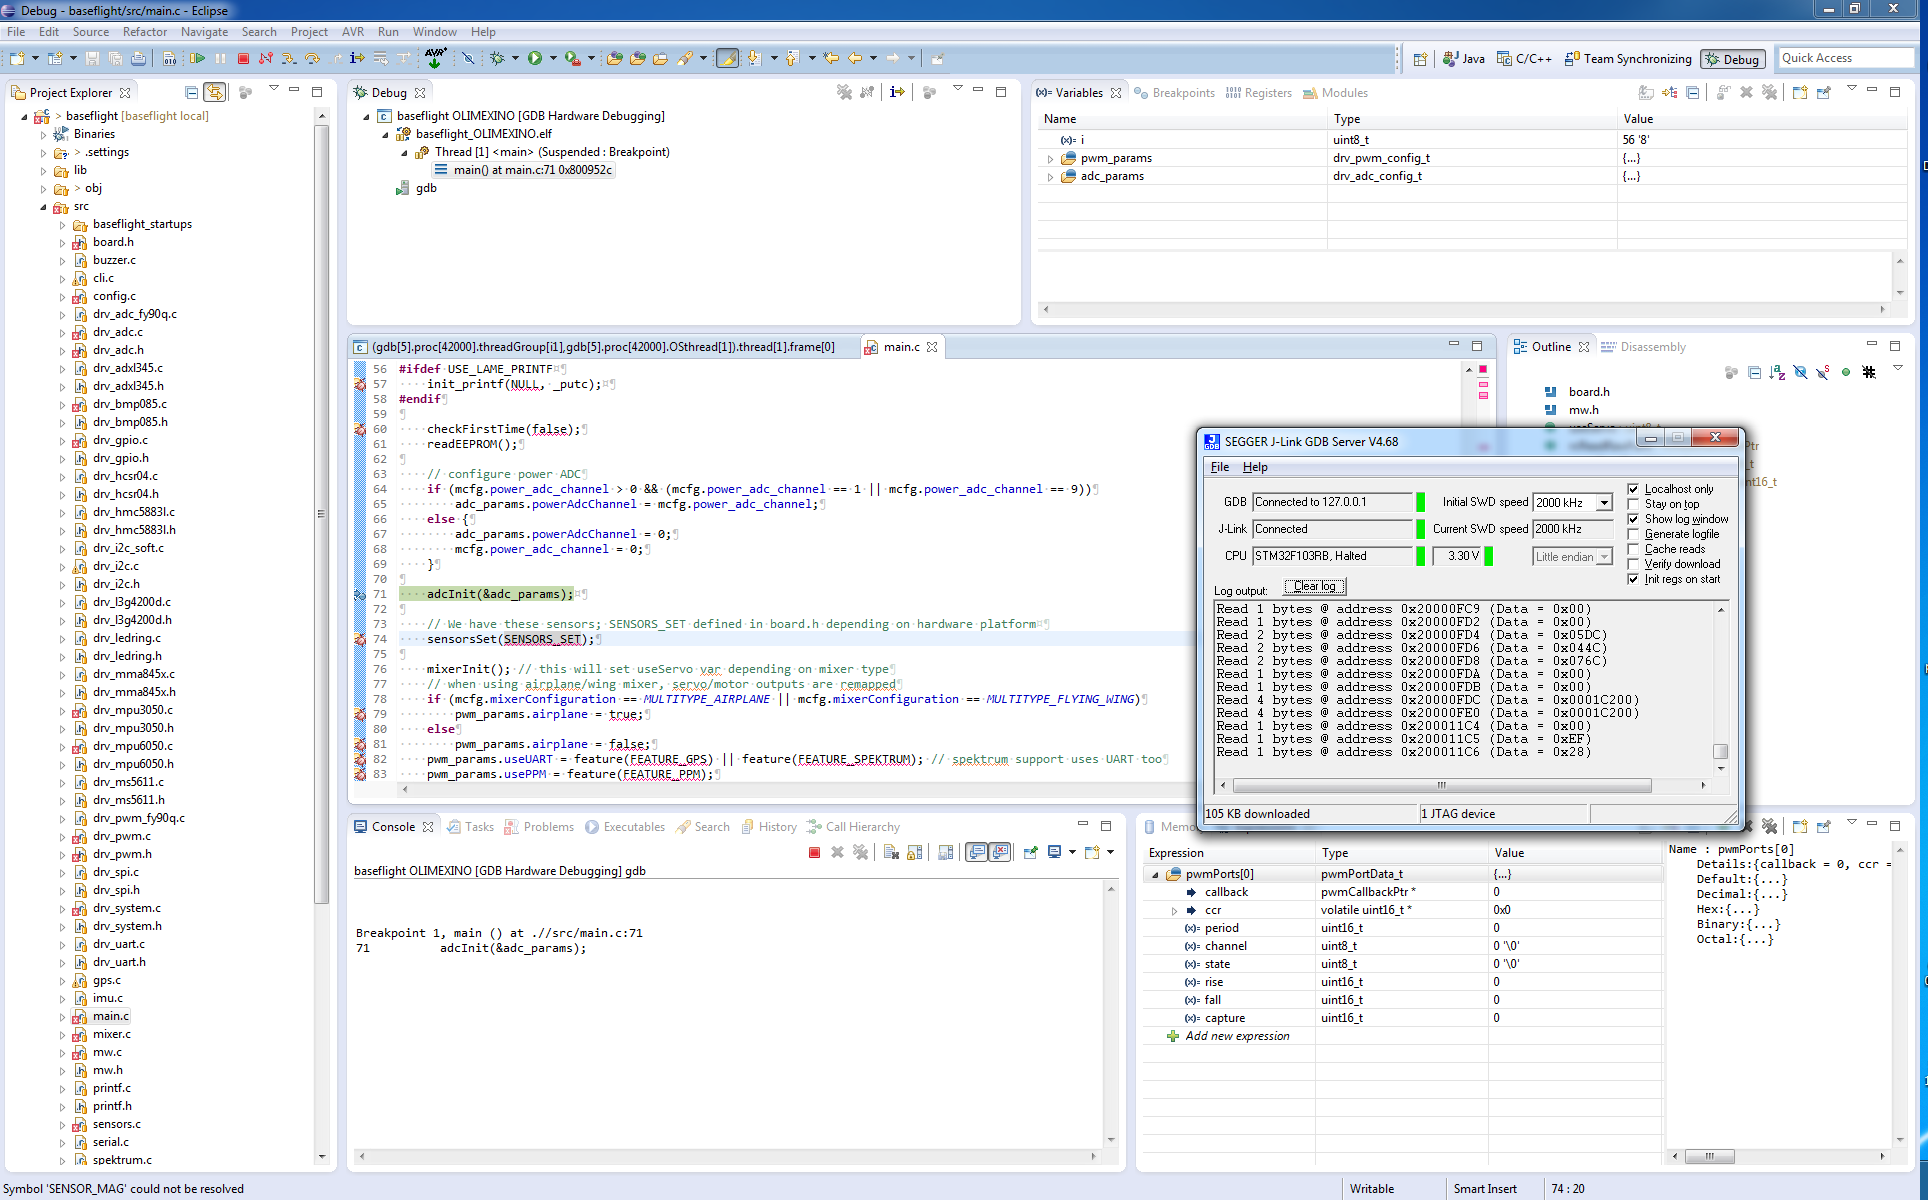
When it's running the J-Link server should look like this.
Then finally you can use Eclipse debug features to inspect variables, memory, stacktrace, set breakpoints, step over code, etc.
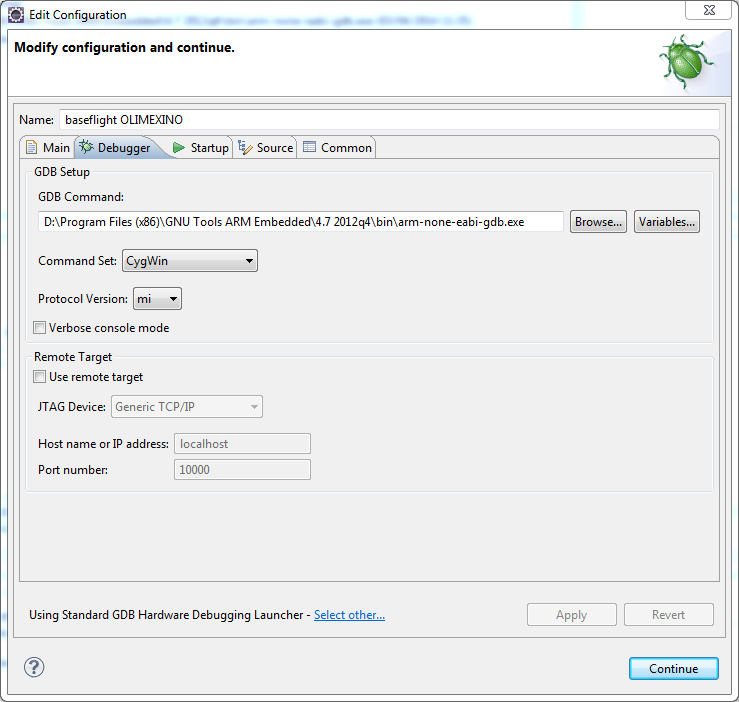
If Eclipse can't find your breakpoints and they are ignored then check your path mappings (if using cygwin) or use the other debugging launcher as follows. Note the 'Select other...' at the bottom of the configuration window.
